Information about the results of the monitoring are available in a variety of formats tailored to a variety use cases.
All plans include the ability to add multiple public or private Status Pages to your account, each of which can show a customizable list of checks. These reports are highly configurable, and are suitable both as stand alone reports or for embedding as iframes in other places. These reports can be configured with a custom domain and free SSL certificates.
Each check on your account automatically has its own status page, which can be customized to suit your needs. These pages can be set to be public or private. Private reports can be viewed by people with logins to the account.
Reports are private by default. Each Status report can be set individually to either private or public, and similarly each check's reports can be set as public or private for each individual check.
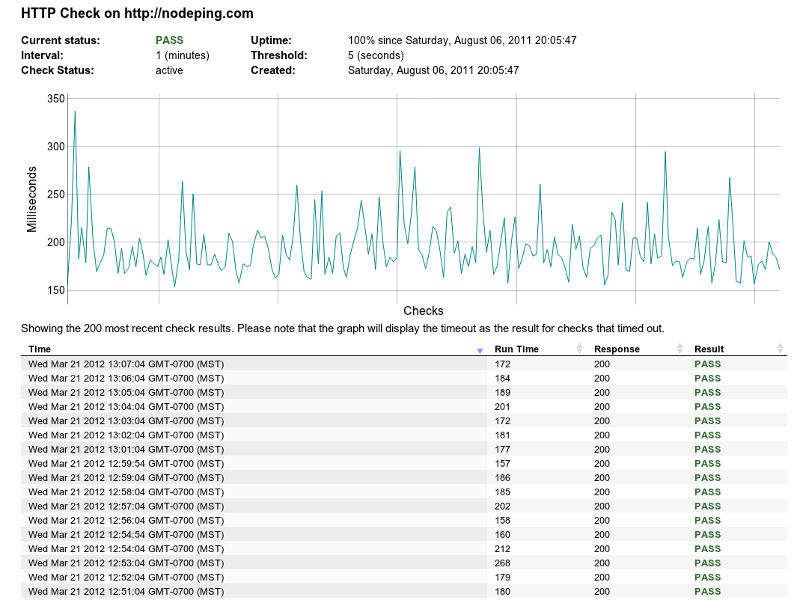
The main screen's list of checks displays whether that check is currently in a PASS or FAIL state. If you click on the words PASS or FAIL, you can see a chart and list of the most recent results for that check.
You can view all notifications that have been sent for each monitoring check by clicking on the "List Notifications." This shows what notifications have been sent, to whom, and what they said. Generally the last month or so of notifications are visible in this list.
The results report shows the most recent results for the check, very similar to the results view discussed above.
Every check is assigned a UUID that is used in the URL's for the reports. The report URL also lets you easily set how many results you want to return by adding / and an integer after the UUID. See the examples below to see how that looks.
This report accepts URL parameters for start and end dates. In most cases, the end date is more useful than start, since the report returns a set number of records sorted by time backwards from that date (in database talk, sorted by date descending). The format for the date is fairly flexible, but we recommend using YYYY-MM-DD. See the URL examples below.
There are also three different ways to get the results of this report. The default is a standard HTML view, as shown in the screenshot. There are links to each format in the main status screen, but you can also change the URL's by hand to adjust the output. Adding a "format" parameter to the URL allows you to change the results to a JSON or CSV format. Changing to CSV causes the browser to treat the report as a download. To set the file name for the download, just append /filename to the URL, where filename is whatever you want to name the file (typically it should end in .csv).
URL examples:
The performance summary report shows the minumum, maximum, and average response time over an hour. By default, it shows 31 days of data. Like results report, you can change the number of results shown by editing the number on the report's URL. You can also retrieve the data in JSON or CSV format by adding ?format=csv or ?format=json to the URL. For CSV output, you can add a file name to the URL as well for convenience (so the URL would end in /filename.csv?format=csv).
URL examples:
The uptime report shows the amount of time that the check has been enabled, how much it has been down, and an uptime percentage. Uptime is calculated based on the time that the check is enabled, so if a check is disabled for a while it does not count against uptime.This report accepts parameters:
As with the other reports, you can also retrieve the data in JSON or CSV format by adding ?format=csv or ?format=json to the URL. For CSV output, you can add a file name to the URL as well for convenience (so the URL would end in /filename.csv?format=csv). Unlike the other reports, this report does not accept a limit number. The start and end date serve a similar purpose.
URL examples:
Each check has a toggle in its configuration that allows you to turn on "public" reports for that check. Once public, the results, uptime, and summary reports can be accessed publicly.
The results, uptime, and summary reports can be accessed using the UUID without needing a login to the account. Note that the UUID is not easily guessable, and we do not publish them. Therefore, while the report is public in the sense that it does not require a login, it will not be readily accessible by anyone who doesn't know the UUID.
The "public" setting also enables public access to the Check Status reports, which are accessible using the Check ID. The Check ID's are somewhat easier to guess.
At present the "public" toggle on the check turns all available reporting for that check to public or private at one time. You cannot make one report public but leave the others as private.
The charts used throughout the site provide some features to understand and view the data better. If you move the mouse over the line in the chart, you'll see the time and result for that time for that point on the chart. This allows you to easily see the details of the results more clearly. You can also zoom in to see the data more closely by dragging either horizontally or vertically on the chart. Double clicking returns you to the default scale.

 Documentation
 Development
 Premiere
 Check Types